domingo, 30 de agosto de 2015

Weekly Portfolio Analysis 30th August 2015

After a quiet year Markets collapsed on Monday. Black Monday, Things could have been worst, but disaster came to reality, and all Index across the world plunged.

SPX made a low on 1868.1 just 18 points away my 1840/50 Sep15 Put Spread. Same situation at Russell 2000. VIX touched 53.3!

We knew there were some trouble ahead but not that panic blowing out most of achievements.
At the end of the week things got a bit better with SPX closing up +0.91%  and RUT +0.72%.

I had to make some adjustments, but with the panic and some IT issues I did not act according to plan. Does anyone know how to see Deltas on IB phone app?

I could not log in till an hour after marketet opened on NY, That was goog as they recovered a bit I tried to  close the positions showing over 30 Delta.  I could not opened new ones, first because I did not have enough funds and second due to the trades 

I open the week before, terrible mistake, and also because I was a bit in panic with that high  volatility. I did the mistake of opening three positions the week earlier when things started to get nasty and that kept me away from opening and exposing myself further.

So SPX Sep15 1840/50 opened at 0.45 was closed at 2.5 making a loss to the portfolio of -3.098%.
Then RUT Sep15 1040/50 opened at 0.60 was closed at 1.944 with a 2.031 loss.
And finally RUT Oct15 1050/60 opened at 0.85 closed at 2.08 with -1.908% loss.

Two days later I opened SPX Sep15  1745/55 at 0.55 trying to make some alpha to mitigate the losses.


Now Bellini portfolio is only 3.246% up for the year, and SPX is down -3.408%
This is how it looks outstanding positions right now


With still 4 cycles to end the year everything could happen, to gain back the losses or to get things worst. Lets try first not to blow up the account.

VIX went completely mad, I like volatility to open PS but not that high. A 53 on VIX was a real crash.


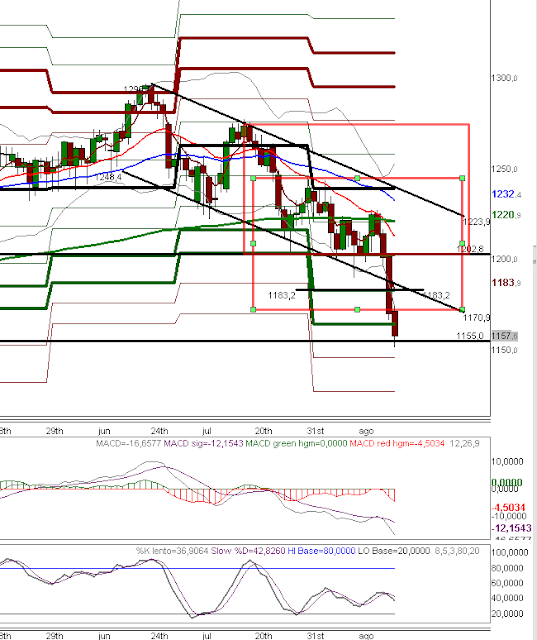
Russell 2000 broke all my targets and fell sharply. Now has moved up and is now 50% retracement on the Fib move down, where sellers will try to move the index down.


SP500 shows similar picture, finding now resistance where some sellers will come out. Although oscillators are finally showing oversold conditions I am being a bit coutios about an V formation, and think we could have more trouble down following weeks. Hope I’m wrong and lets see some low volatility this week.


Plan for the week not to open any Bull trade and defend according to 2 weeks ago plan if things get nasty

@bellinimarkets.com 

lunes, 24 de agosto de 2015

DEFCON 2 : Trades on a Panic Day

The Index droppoed much more sharped than expected. A minute after NY bell got positions In The Money. I kept calm and closed after I consedered enough rebond, always with the panic mood more bears were about to happen.


I closed all positions showing 30 Delta, taking a lost. However part of my plan was to open new positions further down, but I could not get filled did not want to rush.

On the SPX I closed Sep15 1850/40 at 2.5 (opened at 0.45) loosing 2.05 per contract 1250$
On the RUT I closed Sep15 1040/50 at 1.944 (opened at 0.60) loosing 1.34 per contract 972$
On RUT Oct 15 1050/60 closed at 2.08 )opened at 0.85) loosing 1040$

So open positions now look as follows


sábado, 22 de agosto de 2015

Weekly Portfolio Analysis 21 August 2015

The week ended in strong crash mood, China, Fed, Greece all made the excuses to send the markets in big red.

SPX end the week with a  -5.77% loss and  RUT fall  -4.43% in the same period. On the year the SPX show a poor -4.27 YTD. We have hade a very range market the whole year and the falls were kind of expected actually.

August cycle is over and my portfolio was rewarded with 1.6167%, making a good 10.283% for the year 2015.

As VIX was  making new year highs I could not stop myself trying to take advantage of the volatility and added new positions to the portfolio, though the worst was still to come.


My open position looks as follows, and the Delta on the right side shows the position I better adjust and defend nex week in order to not cause much pain to my performance.


SPX Sep15 1850/60 at 23 Delta with 77% probability to ending in out the money will have to be adjusted before getting to 30 deltas. Ideally will try to open new PS Sep15 at 1690/1700 to release some pain of the adjustment.

The other position that concerns me is Oct RUT 1050/1060 with 21 Deltas and 79% porbaility ending out the money. Will try to open 940/930 Oct15 once closed the danger one.

Looking to the markets the VIX rocketed, with a 28.03 made the highest mark of the year, and a very extream number.


Rusell 2000 did what we said had the highest probaility last week, and fell bellow our targets.


Now sits just on the Fib 50% retracement on the last move up, and the trendline makes me believe we are going to find some support here. However the markets are falling as a knife sharp and is better no to stay in the path.


On the other hand the SP500 has break the trendline and is looking also to find support on the fib of last move.


I dont like the Stochastics, showing still room to be in oversold.

I mentioned from weeks ago I didnt like the SPX monthly chart, as the Oscilator were crossing down only seen at the end of the dot.com era and pre Lehman crisis.


domingo, 16 de agosto de 2015

Weekly Porfolio Analysis 15th August 2015

China is giving us the noise needed to justify some volatility in the markets. Printing money is a way of admitting the economy is in bad state and we dont want to ruin the bubble. So the few traders in the market get a bit nervous sending the VIX at 16 and the markets making lows. In the case of the Russell 2000 a lower low from the minmuns of July, but wth no strengh to break the psiclogical 1200 support.

SPX raised this week  0.67% is 1.59% up year to date. On the other hand RUT is 0.33% up for the week. Our portfolio is 8.667% up before comissions waiting to add some positive returns when August cycle is officialy over at the end of next week.

We, as options sellers, tried and got filled in two out of the money spreads this week while the markets tumbled near support. So on 12/08/2015 trades SPX Sep15 1850/40 PS at 0.45 and SPX Oct15 1775/85 at 0.50. All well out of the money bellow 10 deltas.


 So currently open positions are all over 90% probability of ending out of the money, though we still got lots of weeks ahead and no one knows the future.


Getting technicals on the markets lets see how the $VIX raised over 16 to shrink again.


$SPX was just 11 points of  July lows, and 200 EMA help the price to bounce up again.
If we take a look to Oscilators we still are in no man's land as no extreams are yet pointed.


$RUT could not break once again 1200, and got a minimum in the week at 1889. I'm expecting to see this index lower on coming days.


domingo, 9 de agosto de 2015

Weekly Portfolio Analysis 8th August 2015

Markets has ended the week in red for both SPX (-1.25%) and RUT (-2.53%). The SPX performance YTD showa a poor 0.91%. Our Portfolio stays at 8.667% YTS with no trades this week and 12 days left for next expiration cycle.

Markets are in no land man, with no relevant extreams on oscilators. We would have loved to enter new positiones on the Call side but the timing we enter the market was not good enough. We were looking stikes SPX 2250 and RUT 1350.

Current positions are all above 90% probabilty of success so if the market keeps in current levels next week nothing will be done on those. The only trades I currently would care a bit are the Octuber cycle is RUT break the current 1200 supoort.


if we take a look to markets we see VIX has been moveing up in correlation with the market fall, we still see some room to more highs here.


Russell RUT has behave poor over the week and is testing last weeks lows on the psicological 1200.


As the oscilators dont seem to be oversold we can not rule out futther lows and look to 1160/1180 levels on the coming days where the extreme monthy pivot points are.


On the SPX the fall has been smooth, so keep movement on this long term range. Oscilators don show extrems either. The fist big support is at 2050 level we could use to add a Put Spread on this index for Sep cycle.as we already have lots of RUT opened.


Still concerned about this Monthly SPX chart


@bellinimarkets

How are we doing this year?


lunes, 3 de agosto de 2015

Analisis Semanal 02 de Agosto 2015

El pasado Lunes tuvimos una situación de sobreventa en el SPX y RUT en el contexto de mercado alcista donde nos encontramos. Estas son buenas oportunidades para vender opciones put o Put Spreads muy fuera del dinero. En esta ocasión conseguimos vender RUT Oct16 1060/1050 Credit Put Spread por 0.85 USD.
El mes de Julio ha finalizado, y nuestro portfolio se ha apuntado un 1.75% de rentabilidad en el mes, dejando el YTD en un 8.66%. El SPX lleva un YTD de 2.18%. Seguiremos realizando operaciones muy conservadoras aunque no lleguemos al benchmark marcado de un 20% anual.
Actualmente, tenemos posiciones abiertas en los vencimientos de Agosto, Septiembre y Octubre, todas bastante seguros por encima del 92% de probabilidad de terminar fuera del dinero.
Posiciones abiertas

El índice VIX vuelve a caer lo que no hace interesante abrir posiciones nuevas hasta que no alcancemos niveles de 15 o superiores
VIX

El índice de referencia SPX continua moviéndose de manera lateral 2120/2050 como los extremos del canal. En nuestra opinión el mercado tiene pendiente un objetivo Fibonacci en la zona 2180 como proyección de los mínimos y máximos del año.
SPX 310715

El índice RUT aguanto el soporte de 1200 el Lunes, y la base del canal bajista en el que se mueve el índice desde primeros de Julio.
RUT 310715
Quiero dejaros la única sombra que nos preocupa en lo que queda de año, y es estre gráfico mensual del SPX, donde los Osciladores muestran cruces a la baja que en la historia han funcionado bien

Detalle de nuestras operaciones en tiempo real en Twitter
@bellinimarkets